Written on: May 1, 2021 by W. Stephen Tait
Hello, everyone. In many instances, spray packages are qualified for commercial markets with a variety of tests, such consumer preference and corrosion tests.
The statistical average (statistical mean) for each data-group is often used to compare the results between different groups of test variables. However, statistical means hide extreme values that are important for decisions on commercializing new products and line extensions. Not paying attention to extreme values in corrosion data could lead to unexpected package failures.
Figure 1 contains simulated corrosion data for one formula with three different types of spray packages. The data are plotted in the “Box & Whisker” format, which is a graphical representation of the statistical student t-test. The mean value (average) is the small square in the center of each rectangle; the rectangles are + 1 standard error from the mean and the vertical lines with the horizontal bars (whiskers) are + 2 standard errors.
Notice in Figure 1 that the mean (small square) for the second package is the highest, the third package has the next highest mean and the first package has the lowest mean. However, notice also there is overlap of the boxes and whiskers for packages #1 and #3 and the whiskers for all three packages, suggesting that corrosion results for some of the packages might be the same even when their means are different. Therefore, which variables are the same and which are different?
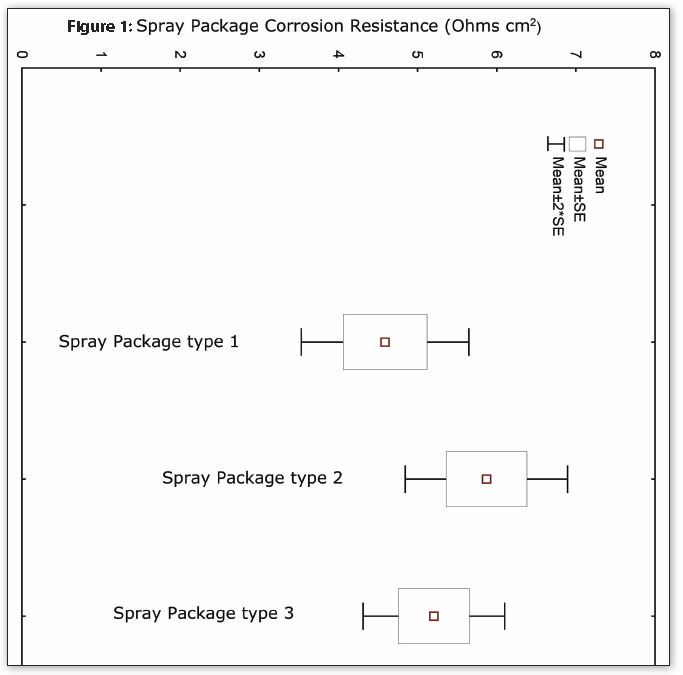
Statistical calculations on the three data sets in Figure 1 indicate that there is an approximately 80% chance that package #2 is more corrosion-resistant than package #1. The same calculations indicate that packages #1 and #3 are statistically the same, plus packages #2 and #3 are also statistically the same. Statistical calculations are not commutative; therefore packages #1 and #2 are not statistically the same even though packages #2 and #3 are the same.
Hence, package #2 is indeed the most corrosion-resistant package of those tested; as well, corrosion test results are the same for packages #1 and #3 even though their means are different. Conclusions based only on statistical means are often incomplete and could lead to unexpected corrosion in commercial aerosol products.
Is it an outlier or an extreme value?
Sometimes one or more replicate samples in a group of nominally identical samples have results that are significantly higher or lower than the majority of the group. Are the small groups of samples extreme values or outliers? Outliers can be omitted from the analysis, but extreme values must be included.
Extreme values are only outliers when there is an assignable reason, such as the package was filled incorrectly—what I refer to as an “experimental-oops.” Extreme values are outliers when there is an experimental-oops associated with the sample.
For example, the product in a single spray package is a water-out emulsion, but the product in all the other packages are oil-out emulsions (as specified). The corrosion data for the package with the unexpected water-out emulsion is an outlier and can be excluded from the corrosion analysis. However, it should be determined why the emulsion for the single sample was different from the rest of the group; just in case there is a systemic problem with emulsion stability that might cause package corrosion.
Extreme value corrosion data provide very valuable information about failures (e.g., leaking or non-spraying containers). For example, an individual extreme value sample having a very low service lifetime indicates that a portion of the packages filled during a year might also have low service lifetimes.
In this situation, the percentage of extremes in the data is used to estimate the risk of corrosion failures (leaking or not spraying) for the entire population. In other words, extreme values also provide a means to estimate risk and prevent unexpected package failures.
In summary, avoid exclusively using statistical means as the only decision-making test parameter. Instead, consider using statistical inference tests, such as the student t-test and/or the Box & Whisker plot along with the means. These others statistical analyses include extremes and provide more accurate measures for whether or not data from supposedly different test variables are indeed different. In addition, an extreme value is only an outlier if there is an experimental-oops associated with the extreme.
Thanks for your interest and I’ll see you in June. Please contact me at 608-831-2076, rustdr@pairodocspro.com or from one of our two websites pairodocspro.com and aristartec.com. SPRAY