Written on: January 1, 2023 by W. Stephen Tait
Hello, everyone. New products and derivative products typically have several timetables. One of these is an ideal timetable for sales (Target Sales) and the other is the actual sales timetable that is determined by the strength or weakness of the economy.
Package corrosion also has a timetable, referred to as the package service life (PSL). A PSL for each product interacts with its product sales timetables to determine if customers and consumers will observe package corrosion.
Observed corrosion manifests itself as leaking packages, partially full packages that no longer spray, packages that dispense discolored product and packages that dispense product with active ingredient concentrations below the specified concentrations.
Let’s review the definitions for Target Sales (TS), Slow Economy Sales (SES) and PSL, as well as how they interact to determine if or when corrosion is observed by customers and consumers.
TS & SES
Target Sales (TS) are typically developed from market research and profit budgets. Typically, TS is the shortest time after production when packages are emptied and recycled. TS is often thought of as a single number, such as “100% of the units produced are purchased, used and recycled within X-days.”
However, TS is typically a curve composed of the unsold inventory at different times. Figure 1 graphically illustrates generic curves for both TS and slow economy sales (SES). Notice that both curves have an S-shape.
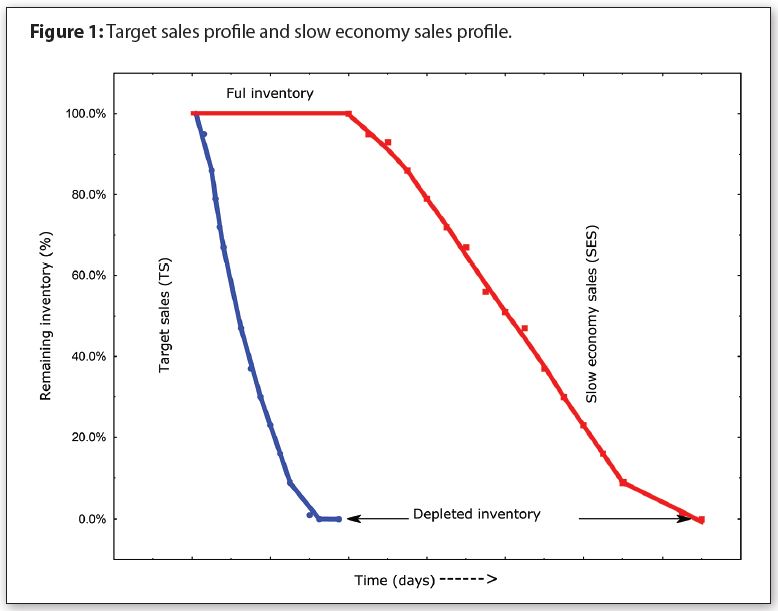
The X-axis in Figure 1 is the time after production when empty packages are recycled. The numbers are left off the X-axis to make it generic. The Y-axis is the percentage of unsold inventory at a given time.
The curve on the left side of Figure 1 is the TS curve and the one on the right is a curve for SES. A fast economy normally decreases production-to-recycle times (desirable) and a slow or stagnant economy increases production-to-recycle times (undesirable). These types of curves could be generated either individually for single production batches or for an entire year’s production.
TS and SES curves do not consider package corrosion. Slow corrosion rates can be hidden by fast economies and a short TS, particularly when all the empty inventory is recycled before package corrosion is observed. Very fast and severe corrosion is typically observed even with a short TS. However, intermediate corrosion rates might not cause detectable corrosion for a TS, but often produce detectable corrosion with a long SES.
Let’s define PSL and then how it interacts with both TS and sales during a slow/stagnant economy, such as occurred during the COVID-19 pandemic.
PSL with corrosion
Package service lifetimes (PSL) are also typically a range of times with associated estimated failure levels (EFL). Figure 2 is an example of PSL-EFL curves with lower-range and upper-range curves. Both are generated with simulated data, but have the same shapes as actual PSL-EFL curves.
The X-axis in Figure 2 has a range of PSL magnitudes and the Y-axis has their corresponding, cumulative EFL magnitudes. The numbers are left off the X-axis to make it generic. The estimated percent package failure levels (EFL) increase with increasing time—in contrast to the TS and SES curves in Figure 1 that both decrease with increasing time.
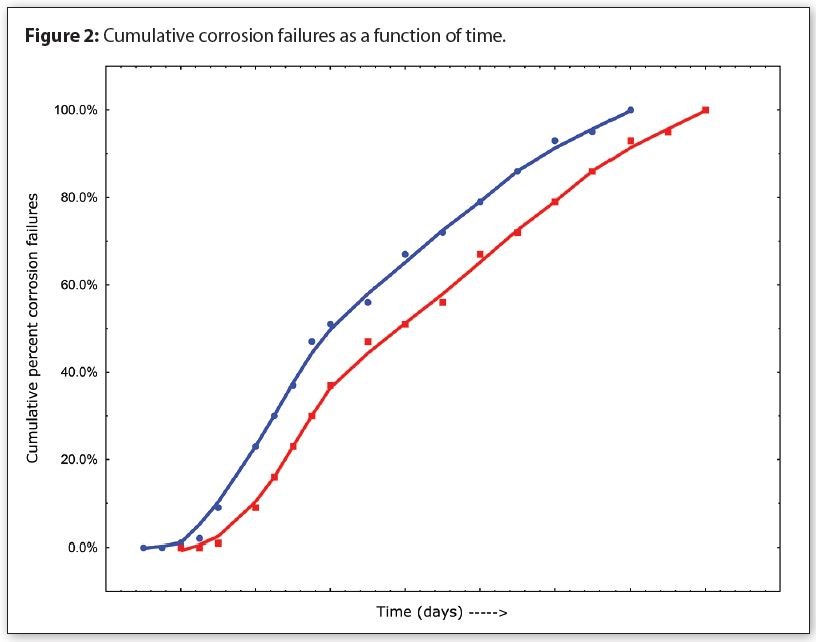
The magnitude of a PSL-EFL curve is determined by:
• The type of package materials;
• Package metal surface treatment (e.g., coated, or uncoated);
• The physical form of a formula (e.g., emulsion or single phase); and
• The chemical composition of your formula and the package corrosion rate
PSL data and its corresponding EFL data are both generated from corrosion data collected from either a long-term storage test or electrochemical corrosion testing.
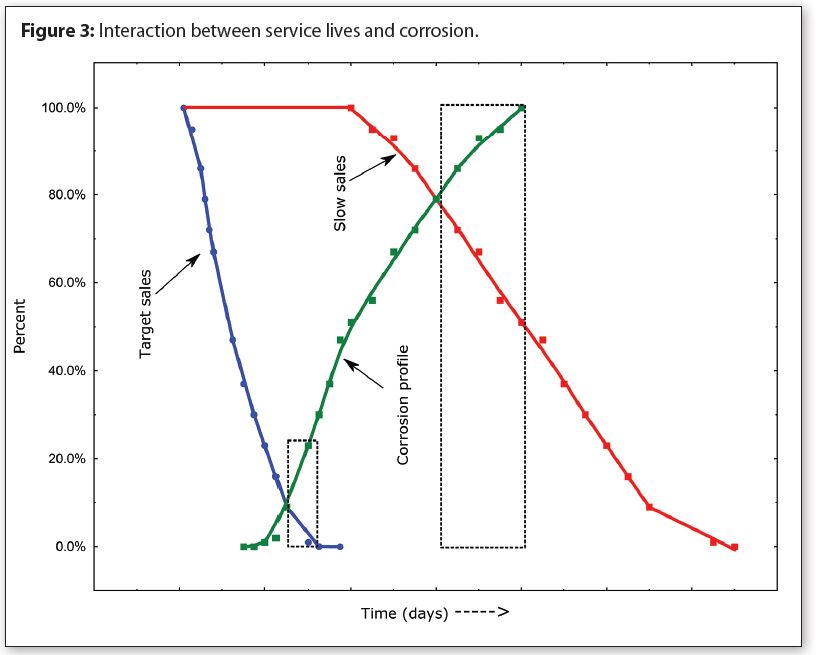
Figure 3 illustrates the relationship between TS, SES and PSL by overlaying Figure 1 with a single PSL-EFL curve from Figure 2 (done for clarity).
The small dashed box on the left of Figure 3 illustrates corrosion overlapping TS and the large one on the right illustrates corrosion overlapping SES.
Figure 3 illustrates why it is less likely that customers and consumers will observe corrosion with a TS than with a SES, particularly when corrosion rates are low. If you shift the PSL-EFL curve to the left you will see why severe corrosion is observed even when the TS is short.
I recommend generating a PSL-EFL curve for all spray package products and derivative products and comparing the curves with the product’s TS and several scenarios with different SES curves. These comparisons can enhance production planning and avoid surprise corrosion when sales become slower than originally planned.
This same recommendation applies to other types of metal packages or laminated metal foil packages that are used for various consumer packaged goods, foods, beverages and pharmaceutical products.
Thanks for your interest and I’ll see you in February. Contact me at 608-831-2076; rustdr@pairodocspro.com or from our two websites: pairodocspro.com and aristartec.com. SPRAY